
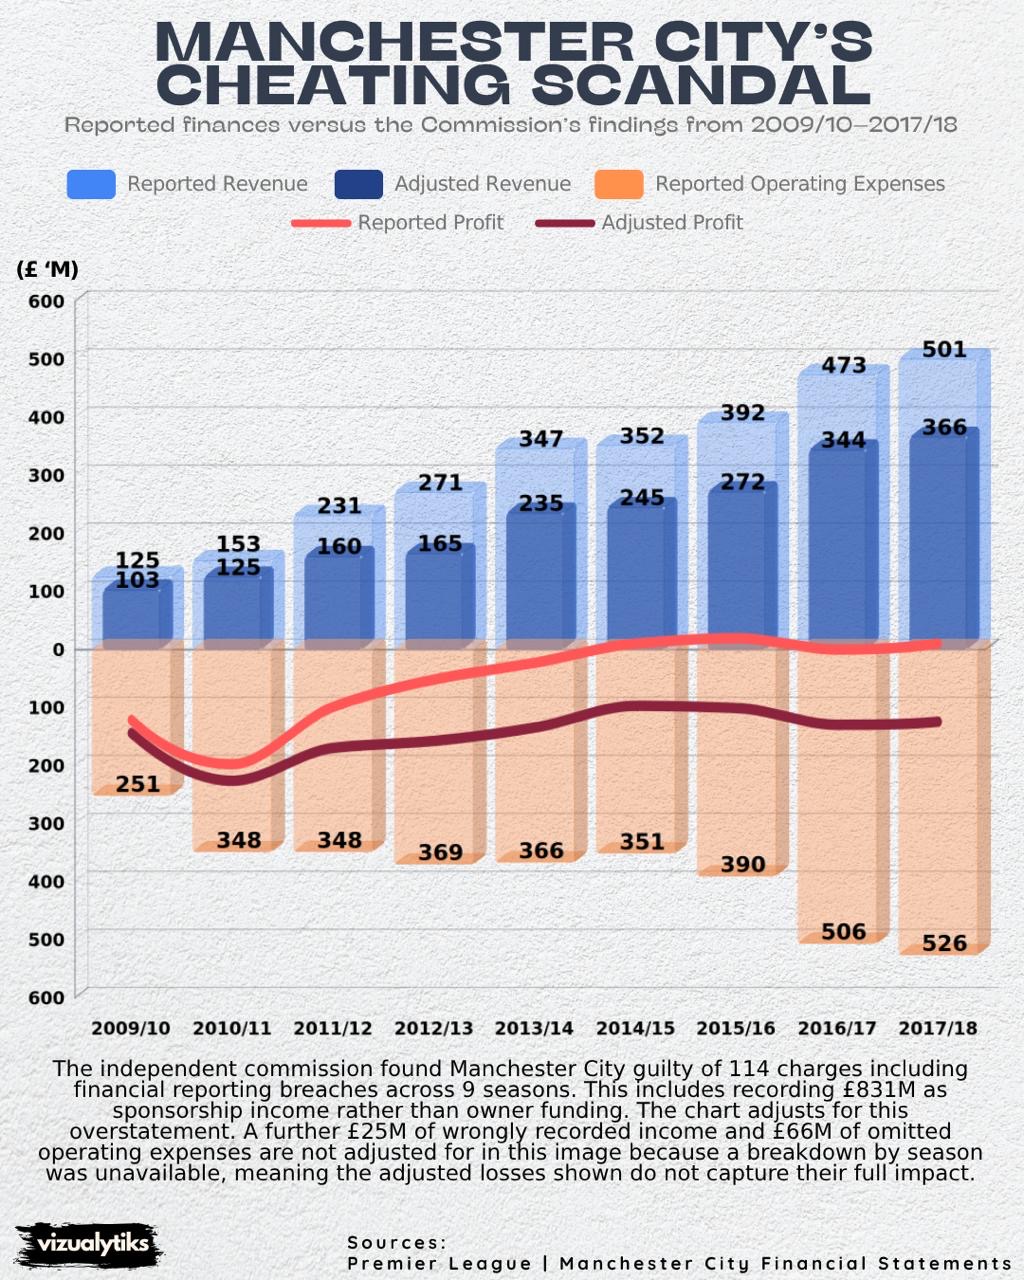
Manchester City’s reported revenue and profits are compared with the Commission’s findings across nine seasons, from 2009/10 to 2017/18.
The chart adjusts revenue for the sponsorship income overstatement described in the infographic. Additional income and operating expense adjustments without a season-by-season breakdown are excluded.